Просмотр новости
Найдите то, что Вас интересует
 Спутники
 РН
РН SpaceX
 Роскосмос
 NASA
NASA
СпутникиРНSpaceXРоскосмосNASAHalf of Americans currently hold an unfavorable opinion of the Supreme Court, while roughly as many view the court favorably.
Just over half of Americans (53%) currently have an unfavorable opinion of the U.S. Supreme Court, while a smaller share (45%) views the court favorably.
Opinions of the court have been relatively stable over the last few years, and favorable views remain close to a three-decade low, according to a Pew Research Center survey of U.S. adults. The survey was conducted July 6-12, 2026, shortly after the court’s 2025-26 term ended.
The court’s favorable rating is 20 percentage points lower today than in April 2021, when 65% of Americans held a positive view.
Favorable views of the Supreme Court remain near historic low
% who say they have a(n) __ opinion of the Supreme Court
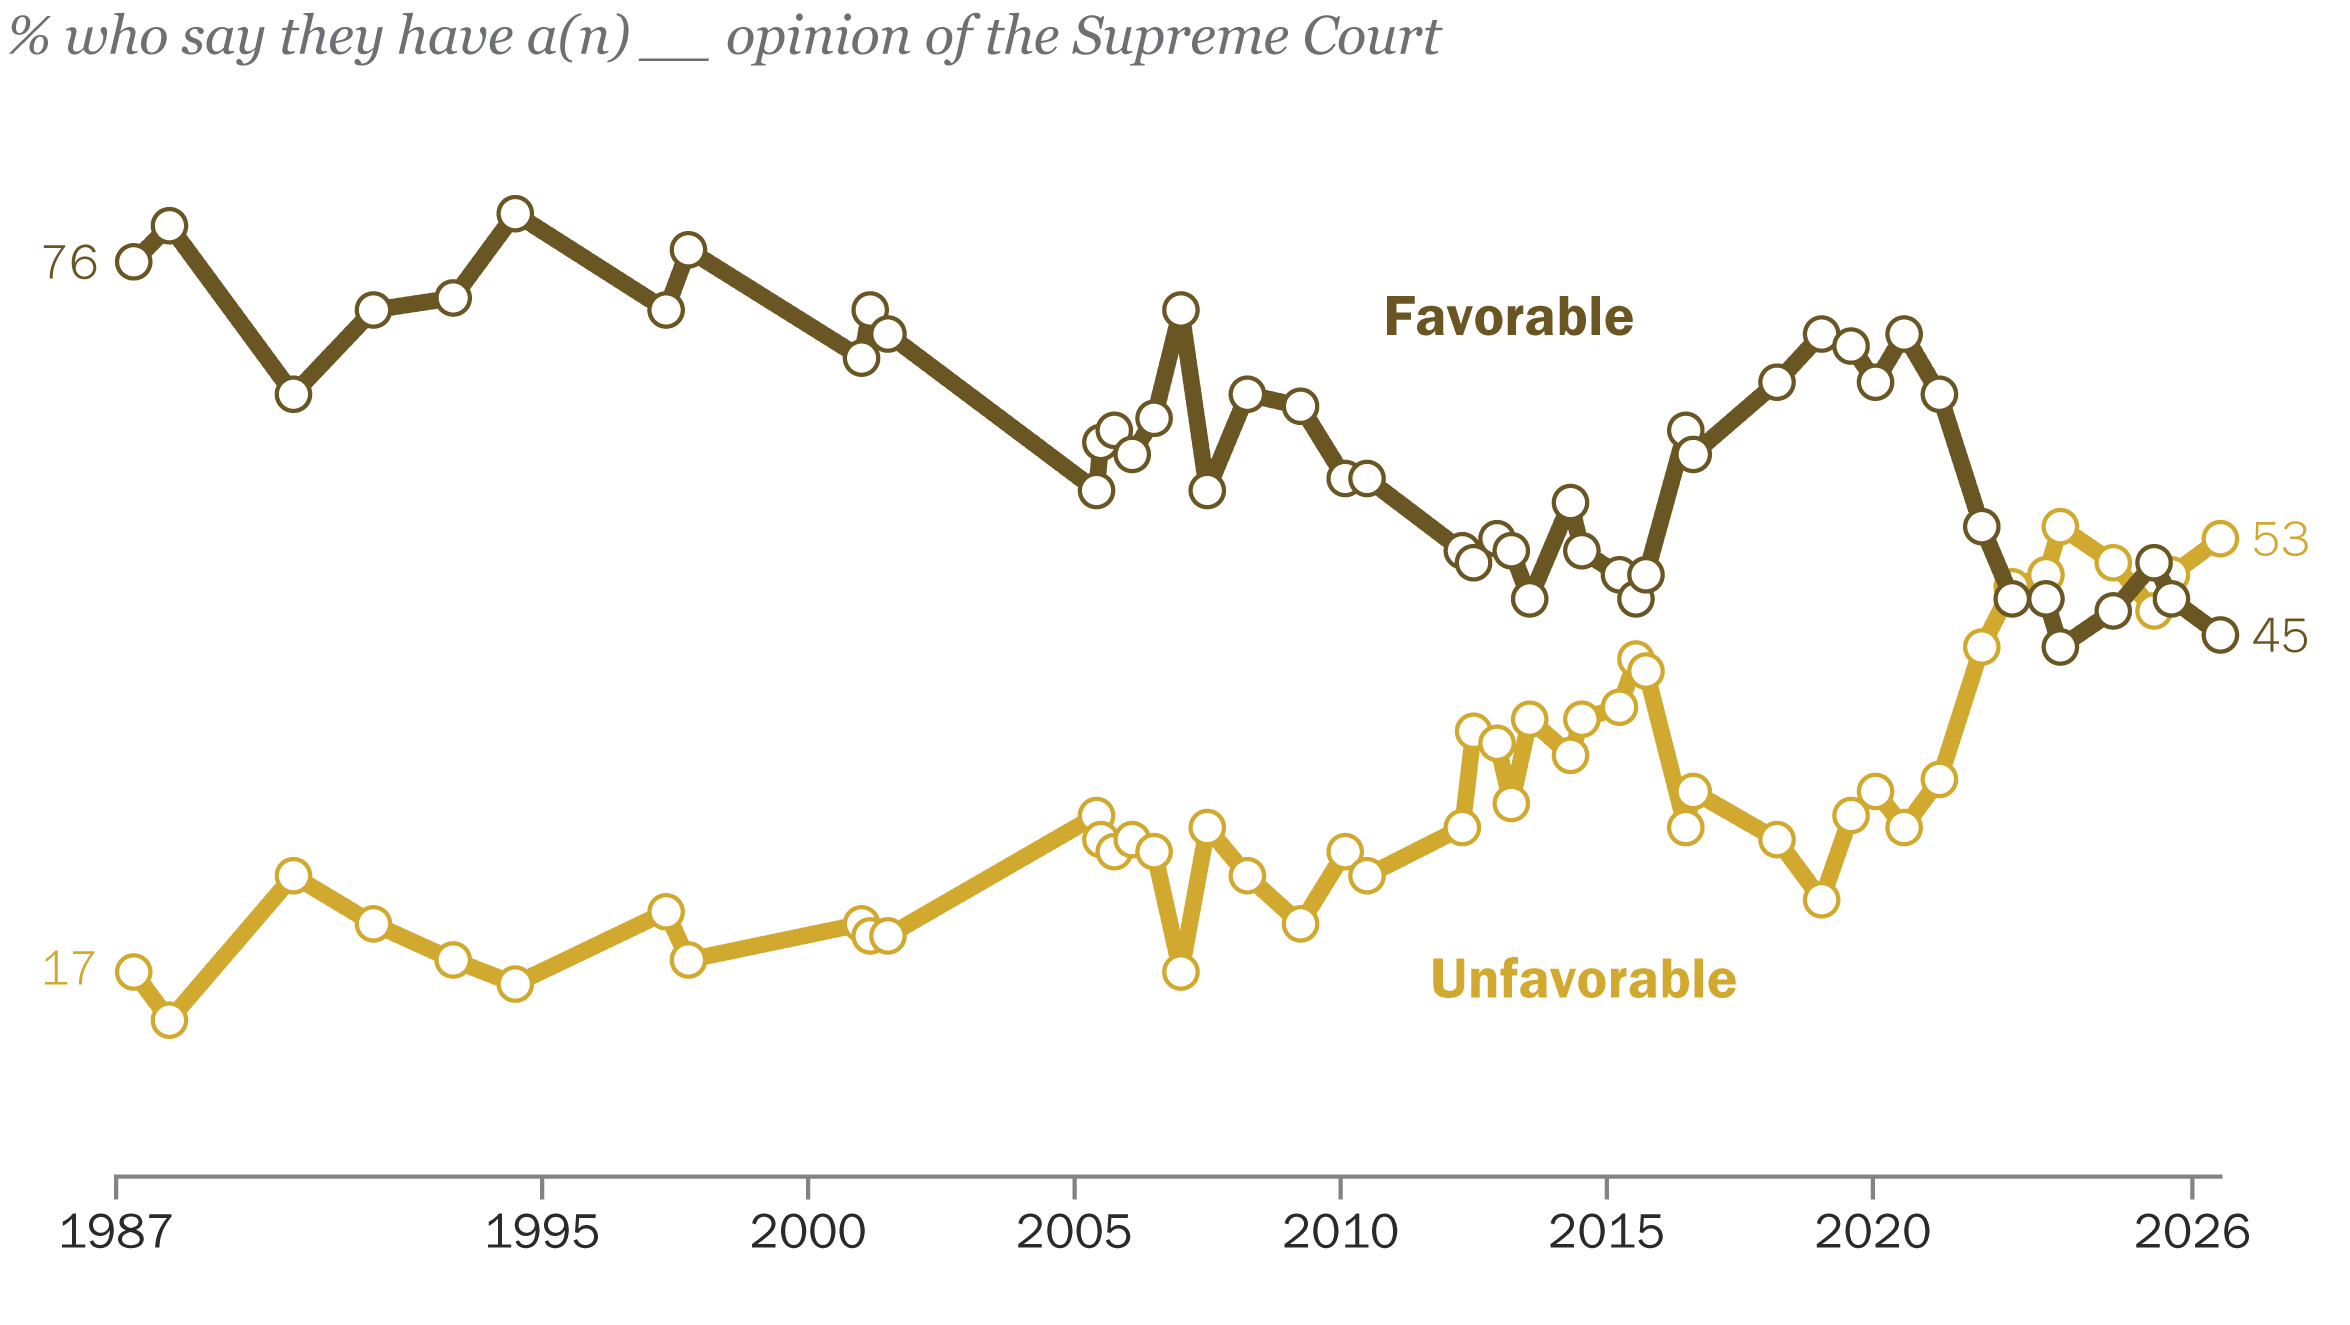
% who say they have a favorable opinion of the Supreme Court
Note: No answer responses are not shown. Survey data is from Pew Research Center’s American Trends Panel (August 2019-July 2026) and Center phone surveys (1987-January 2019).
Source: Survey of U.S. adults conducted July 6-12, 2026.
PEW RESEARCH CENTER
Favorable views of the Supreme Court remain near historic low
% who say they have a(n) __ opinion of the Supreme Court
| Date | Favorable | Unfavorable |
|---|---|---|
| 2026-07-12 | 45 | 53 |
| 2025-08-10 | 48 | 50 |
| 2025-04-13 | 51 | 47 |
| 2024-07-07 | 47 | 51 |
| 2023-07-10 | 44 | 54 |
| 2023-04-02 | 48 | 50 |
| 2022-08-14 | 48 | 49 |
| 2022-01-17 | 54 | 44 |
| 2021-04-01 | 65 | 33 |
| 2020-08-02 | 70 | 29 |
| 2020-01-19 | 66 | 32 |
| 2019-08-04 | 69 | 30 |
| 2019-01-14 | 70 | 23 |
| 2018-03-14 | 66 | 28 |
| 2016-08-16 | 60 | 32 |
| 2016-06-26 | 62 | 29 |
| 2015-09-27 | 50 | 42 |
| 2015-07-20 | 48 | 43 |
| 2015-03-29 | 50 | 39 |
| 2014-07-14 | 52 | 38 |
| 2014-04-27 | 56 | 35 |
| 2013-07-21 | 48 | 38 |
| 2013-03-17 | 52 | 31 |
| 2012-12-09 | 53 | 36 |
| 2012-07-01 | 51 | 37 |
| 2012-04-15 | 52 | 29 |
| 2010-07-01 | 58 | 25 |
| 2010-02-01 | 58 | 27 |
| 2009-04-01 | 64 | 21 |
| 2008-04-01 | 65 | 25 |
| 2007-07-01 | 57 | 29 |
| 2007-01-01 | 72 | 17 |
| 2006-07-01 | 63 | 27 |
| 2006-02-01 | 60 | 28 |
| 2005-10-01 | 62 | 27 |
| 2005-07-01 | 61 | 28 |
| 2005-06-01 | 57 | 30 |
| 2001-07-01 | 70 | 20 |
| 2001-03-01 | 72 | 20 |
| 2001-01-01 | 68 | 21 |
| 1997-10-01 | 77 | 18 |
| 1997-05-01 | 72 | 22 |
| 1994-07-01 | 80 | 16 |
| 1993-05-01 | 73 | 18 |
| 1991-11-01 | 72 | 21 |
| 1990-05-01 | 65 | 25 |
| 1988-01-01 | 79 | 13 |
| 1987-05-01 | 76 | 17 |
| 1985-03-01 | 64 | 28 |
| Date | Rep/Lean Rep | Dem/Lean Dem |
| 2026-07-12 | 69 | 25 |
| 2025-08-10 | 71 | 26 |
| 2025-04-13 | 73 | 30 |
| 2024-07-07 | 73 | 24 |
| 2023-07-10 | 68 | 24 |
| 2023-04-02 | 68 | 31 |
| 2022-08-14 | 73 | 28 |
| 2022-01-17 | 65 | 46 |
| 2021-04-01 | 67 | 65 |
| 2020-08-02 | 75 | 67 |
| 2020-01-19 | 78 | 58 |
| 2019-08-04 | 85 | 57 |
| 2019-01-14 | 82 | 63 |
| 2018-03-14 | 71 | 62 |
| 2016-08-16 | 51 | 70 |
| 2016-06-26 | 55 | 72 |
| 2015-09-27 | 38 | 64 |
| 2015-07-20 | 33 | 61 |
| 2015-03-29 | 49 | 54 |
| 2014-07-14 | 53 | 54 |
| 2014-04-27 | 52 | 61 |
| 2013-07-21 | 47 | 53 |
| 2013-03-17 | 46 | 58 |
| 2012-12-09 | 41 | 64 |
| 2012-07-01 | 40 | 62 |
| 2012-04-15 | 55 | 52 |
| 2010-07-01 | 53 | 66 |
| 2010-02-01 | 62 | 58 |
| 2009-04-01 | 74 | 64 |
| 2008-04-01 | 76 | 60 |
| 2007-07-01 | 69 | 52 |
| 2007-01-01 | 82 | 70 |
| 2006-07-01 | 70 | 58 |
| 2006-02-01 | 75 | 50 |
| 2005-10-01 | 72 | 59 |
| 2005-07-01 | 68 | 58 |
| 2005-06-01 | 65 | 54 |
| 2001-07-01 | 80 | 65 |
| 2001-03-01 | 83 | 67 |
| 2001-01-01 | 80 | 61 |
| 1997-10-01 | 76 | 81 |
| 1997-05-01 | 69 | 78 |
| 1994-07-01 | 79 | 83 |
| 1993-05-01 | 73 | 75 |
| 1991-11-01 | 80 | 66 |
| 1990-05-01 | 73 | 58 |
| 1988-01-01 | 84 | 78 |
| 1987-05-01 | 80 | 75 |
Note: No answer responses are not shown. Survey data is from Pew Research Center’s American Trends Panel (August 2019-July 2026) and Center phone surveys (1987-January 2019).
Source: Survey of U.S. adults conducted July 6-12, 2026.
PEW RESEARCH CENTER
This Pew Research Center analysis looks at Americans’ views of the Supreme Court.
Why did we do this?Pew Research Center does research to help the public, media and decision-makers understand important topics. We have studied Americans’ views of politics and major policy issues, including the Supreme Court, for decades.
Learn more about Pew Research Center and our politics research.
We surveyed 3,554 U.S. adults from July 6 to 12, 2026. Everyone who took part in this survey is a member of the Center’s American Trends Panel. The survey represents the views of the full U.S. adult population.
Here are the survey questions used for this analysis, the detailed responses and the survey methodology.
This analysis also uses data from a Center survey conducted Aug. 4 to 10, 2025. Here are the 2025 survey questions, along with the responses, and the survey methodology.
How Democrats and Republicans see the Supreme CourtA quarter of Democrats and Democratic-leaning independents view the Supreme Court favorably. That is similar to recent years and one of the lowest favorable ratings of the court from either party in the more than 30 years since we first asked the question.
As recently as 2021 – before the court’s 2022 decision to overturn the federal right to abortion – nearly two-thirds of Democrats had a favorable impression of the court.
By contrast, Republicans and GOP leaners are much more likely to view the high court favorably, with 69% having a positive opinion. Republicans’ opinions of the court have changed much less than Democrats’ in recent years.
Perceptions of the Supreme Court’s ideologyMore than four-in-ten Americans (43%) view the Supreme Court as conservative. A similar share (44%) view it as “middle of the road.” Only 9% describe the court as liberal.
Public perceptions of the Supreme Court’s ideology have not changed much in the past few years. Compared with 2020, however, Americans are now more likely to describe the court as conservative.
Democrats remain more likely than Republicans to view the Supreme Court as conservative:
Most Democrats view Supreme Court as conservative; two-thirds of Republicans say it is ‘middle of the road’
% who say the current Supreme Court is …

Note: No answer responses are not shown.
Source: Survey of U.S. adults conducted July. 6-12, 2026.
PEW RESEARCH CENTER
Most Democrats view Supreme Court as conservative; two-thirds of Republicans say it is ‘middle of the road’
% who say the current Supreme Court is …
| Date | Group | Conservative | Middle of the road | Liberal | grouping |
|---|---|---|---|---|---|
| Aug ’20 | Total | 30 | 56 | 12 | Total |
| Jan ’22 | Total | 38 | 48 | 9 | Total |
| Aug ’22 | Total | 49 | 41 | 7 | Total |
| Jul ’23 | Total | 50 | 40 | 7 | Total |
| Jul ’24 | Total | 48 | 42 | 7 | Total |
| Aug ’25 | Total | 47 | 44 | 7 | Total |
| Jul ’26 | Total | 43 | 44 | 9 | Total |
| Aug ’20 | Rep/Lean Rep | 12 | 66 | 20 | Rep/Lean Rep |
| Jan ’22 | Rep/Lean Rep | 18 | 62 | 17 | Rep/Lean Rep |
| Aug ’22 | Rep/Lean Rep | 32 | 57 | 9 | Rep/Lean Rep |
| Jul ’23 | Rep/Lean Rep | 32 | 57 | 9 | Rep/Lean Rep |
| Jul ’24 | Rep/Lean Rep | 30 | 59 | 9 | Rep/Lean Rep |
| Aug ’25 | Rep/Lean Rep | 28 | 63 | 9 | Rep/Lean Rep |
| Jul ’26 | Rep/Lean Rep | 19 | 66 | 13 | Rep/Lean Rep |
| Aug ’20 | Dem/Lean Dem | 47 | 47 | 4 | Dem/Lean Dem |
| Jan ’22 | Dem/Lean Dem | 57 | 37 | 4 | Dem/Lean Dem |
| Aug ’22 | Dem/Lean Dem | 67 | 27 | 5 | Dem/Lean Dem |
| Jul ’23 | Dem/Lean Dem | 71 | 24 | 4 | Dem/Lean Dem |
| Jul ’24 | Dem/Lean Dem | 70 | 25 | 4 | Dem/Lean Dem |
| Aug ’25 | Dem/Lean Dem | 69 | 25 | 6 | Dem/Lean Dem |
| Jul ’26 | Dem/Lean Dem | 67 | 27 | 5 | Dem/Lean Dem |
Note: No answer responses are not shown.
Source: Survey of U.S. adults conducted July. 6-12, 2026.
PEW RESEARCH CENTER
More than half of Americans (56%) say the Supreme Court has the right amount of power, while 32% say it has too much power. One-in-ten say the court has too little power.
Americans’ views on the Supreme Court’s power are nearly identical to what they were last year. However, the share saying the court has too much power is lower than it was between 2022 and 2024.
Among Democrats, 43% say the court has too much power. That’s unchanged from a year ago, but down 19 points from 2024.
Republicans continue to be more likely than Democrats to say the court has the right amount of power (71% vs. 44%). Republicans’ views on how much power the court has have changed little in the past few years.
Democrats are divided on whether Supreme Court has too much power; most Republicans say it has the right amount
% who say the Supreme Court has …

Note: No answer responses are not shown.
Source: Survey of U.S. adults conducted July 6-12, 2026.
PEW RESEARCH CENTER
Democrats are divided on whether Supreme Court has too much power; most Republicans say it has the right amount
% who say the Supreme Court has …
| Date | Group | Too much power | Right amount of power | Too little power |
|---|---|---|---|---|
| Aug ’20 | Total | 25 | 65 | 8 |
| Jan ’22 | Total | 30 | 58 | 11 |
| Aug ’22 | Total | 45 | 48 | 5 |
| Jul ’23 | Total | 40 | 51 | 7 |
| Jul ’24 | Total | 42 | 50 | 6 |
| Aug ’25 | Total | 32 | 57 | 9 |
| Jul ’26 | Total | 32 | 56 | 10 |
| Aug ’20 | Rep/Lean Rep | 27 | 66 | 6 |
| Jan ’22 | Rep/Lean Rep | 18 | 71 | 10 |
| Aug ’22 | Rep/Lean Rep | 23 | 70 | 6 |
| Jul ’23 | Rep/Lean Rep | 20 | 74 | 5 |
| Jul ’24 | Rep/Lean Rep | 22 | 71 | 6 |
| Aug ’25 | Rep/Lean Rep | 24 | 71 | 4 |
| Jul ’26 | Rep/Lean Rep | 22 | 71 | 6 |
| Aug ’20 | Dem/Lean Dem | 23 | 64 | 11 |
| Jan ’22 | Dem/Lean Dem | 40 | 49 | 11 |
| Aug ’22 | Dem/Lean Dem | 64 | 31 | 4 |
| Jul ’23 | Dem/Lean Dem | 60 | 31 | 7 |
| Jul ’24 | Dem/Lean Dem | 62 | 31 | 5 |
| Aug ’25 | Dem/Lean Dem | 43 | 43 | 13 |
| Jul ’26 | Dem/Lean Dem | 43 | 44 | 12 |
Note: No answer responses are not shown.
Source: Survey of U.S. adults conducted July 6-12, 2026.
PEW RESEARCH CENTER
Most Black Americans, adults under 50 view the Supreme Court unfavorably
% who say they have a(n) __ opinion of the Supreme Court

* Estimates for Asian adults are representative of English speakers only.
Note: White, Black and Asian adults include only those who report being one race and are not Hispanic. Hispanic adults are of any race. “Some college” includes those with an associate degree and those who attended college but did not obtain a degree. No answer responses are not shown.
Source: Survey of U.S. adults conducted July 6-12, 2026.
PEW RESEARCH CENTER
Most Black Americans, adults under 50 view the Supreme Court unfavorably
% who say they have a(n) __ opinion of the Supreme Court
| Group | NET Unfavorable | Very Unfavorable | Mostly Unfavorable | Mostly Favorable | Very Favorable | NET Favorable | Grouping |
|---|---|---|---|---|---|---|---|
| Total | 53 | 20 | 33 | 41 | 4 | 45 | total |
| Men | 50 | 20 | 31 | 43 | 6 | 49 | gender |
| Women | 54 | 19 | 35 | 39 | 3 | 42 | gender |
| White | 50 | 19 | 31 | 44 | 5 | 48 | race |
| Hispanic | 55 | 18 | 37 | 36 | 5 | 42 | race |
| Black | 67 | 29 | 37 | 29 | 2 | 31 | race |
| Asian* | 48 | 15 | 33 | 45 | 4 | 49 | race |
| Ages 18-29 | 60 | 21 | 39 | 34 | 4 | 38 | age |
| 30-49 | 55 | 21 | 34 | 39 | 4 | 43 | age |
| 50-64 | 48 | 17 | 31 | 45 | 4 | 49 | age |
| 65+ | 48 | 20 | 28 | 44 | 6 | 50 | age |
| Postgrad | 58 | 23 | 35 | 37 | 4 | 41 | education |
| College grad | 54 | 21 | 33 | 41 | 4 | 45 | education |
| Some college | 56 | 21 | 35 | 37 | 4 | 41 | education |
| HS or less | 47 | 17 | 30 | 45 | 5 | 50 | education |
| Rep/Lean Rep | 30 | 7 | 23 | 62 | 7 | 69 | party rep |
| Conserv | 27 | 6 | 21 | 65 | 7 | 72 | party rep |
| Mod/Lib | 35 | 9 | 26 | 58 | 5 | 63 | party rep |
| Dem/Lean Dem | 74 | 32 | 42 | 22 | 3 | 25 | party dem |
| Cons/Mod | 65 | 23 | 42 | 30 | 4 | 34 | party dem |
| Liberal | 85 | 43 | 42 | 13 | 1 | 14 | party dem |
* Estimates for Asian adults are representative of English speakers only.
Note: White, Black and Asian adults include only those who report being one race and are not Hispanic. Hispanic adults are of any race. “Some college” includes those with an associate degree and those who attended college but did not obtain a degree. No answer responses are not shown.
Source: Survey of U.S. adults conducted July 6-12, 2026.
PEW RESEARCH CENTER
There are only modest gender differences in views of the Supreme Court: 49% of men and 42% of women view it favorably.
Two-thirds of Black adults (67%) express an unfavorable opinion of the court. That compares with roughly half of Hispanic (55%), White (50%) and Asian adults (48%).
Among adults under 50, a 56% majority views the court unfavorably, while 41% view it favorably. By contrast, half of those 50 and older have a favorable opinion, while 48% have an unfavorable one.
Americans with a college degree or more education are also more likely than those without a degree to view the court negatively (56% vs. 51%).
Differences in views of the court within each partyAmong Republicans, older adults view the Supreme Court more favorably
% who have a favorable opinion of the Supreme Court

* Estimates for Asian adults are representative of English speakers only.
Note: White, Black and Asian adults include only those who report being one race and are not Hispanic. Hispanic adults are of any race. “Some college” includes those with an associate degree and those who attended college but did not obtain a degree. Insufficient sample to report on Black Republicans.
Source: Survey of U.S. adults conducted July 6-12, 2026.
PEW RESEARCH CENTER
Among Republicans, older adults view the Supreme Court more favorably
% who have a favorable opinion of the Supreme Court
| Group | Total | Rep/Lean Rep | Dem/Lean Dem | grouping |
|---|---|---|---|---|
| Total | 45 | 69 | 25 | total |
| Men | 49 | 70 | 24 | gender |
| Women | 42 | 67 | 25 | gender |
| White | 48 | 70 | 20 | race |
| Hispanic | 42 | 64 | 32 | race |
| Black | 31 | – | 27 | race |
| Asian* | 49 | 74 | 36 | race |
| Ages 18-29 | 38 | 59 | 22 | age |
| 30-49 | 43 | 63 | 27 | age |
| 50-64 | 49 | 75 | 22 | age |
| 65+ | 50 | 76 | 26 | age |
| Postgrad | 41 | 81 | 17 | education |
| College grad | 45 | 74 | 20 | education |
| Some college | 41 | 66 | 22 | education |
| HS or less | 50 | 65 | 35 | education |
* Estimates for Asian adults are representative of English speakers only.
Note: White, Black and Asian adults include only those who report being one race and are not Hispanic. Hispanic adults are of any race. “Some college” includes those with an associate degree and those who attended college but did not obtain a degree. Insufficient sample to report on Black Republicans.
Source: Survey of U.S. adults conducted July 6-12, 2026.
PEW RESEARCH CENTER
Though few Democrats view the Supreme Court positively, those with lower levels of educational attainment see it more positively than those with greater levels of education do. The opposite is true among Republicans.
In addition, older Republicans continue to view the high court more favorably than younger Republicans do. Three-quarters of Republicans ages 50 and older see the court positively, while 62% of those under 50 say the same.
Supreme Court justices and their political views in courtWe also asked Americans in an August 2025 survey whether they think Supreme Court justices’ political views should be part of their decision-making.
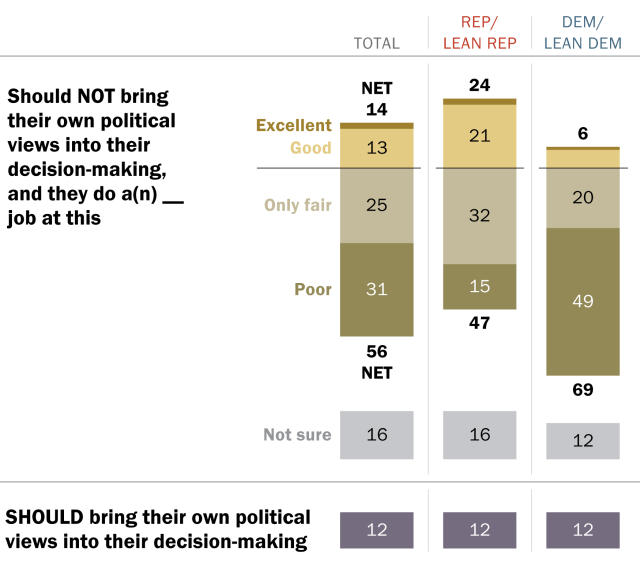
Overall, 86% said the justices should not bring their political views into decision-making. Just 12% said they should.
In 2025, Democrats were far more likely than Republicans to say justices do a poor job keeping their politics out of court
% who said Supreme Court justices …
Note: No answer responses are not shown.
Source: Survey of U.S. adults conducted Aug. 4-10, 2025.
PEW RESEARCH CENTER
In 2025, Democrats were far more likely than Republicans to say justices do a poor job keeping their politics out of court
% who said Supreme Court justices …
| Group | NET Only fair/Poor | Poor | Only fair | Good | Excellent | NET Excellent/Good | Not sure | Should decide based on their own political views |
|---|---|---|---|---|---|---|---|---|
| Total | 56 | 31 | 25 | 13 | 2 | 14 | 16 | 12 |
| Rep/Lean Rep | 47 | 15 | 32 | 21 | 2 | 24 | 16 | 12 |
| Dem/Lean Dem | 69 | 49 | 20 | 6 | 1 | 6 | 12 | 12 |
Note: No answer responses are not shown.
Source: Survey of U.S. adults conducted Aug. 4-10, 2025.
PEW RESEARCH CENTER
Equal majorities of Democrats and Republicans (87%) said the justices should not bring personal politics into decisions.
In addition, 14% of Americans said the justices do an excellent or good job of keeping politics out of decision-making, while 56% said they do an only fair or poor job.
Democrats were much more likely than Republicans to say the justices don’t do a good job keeping personal politics out of their decisions:
Note: Here are the survey questions used for this analysis, the detailed responses and the survey methodology. This is an update of a post originally published July 21, 2023, by Katy Lin and Carroll Doherty. It was updated previously on Sept. 3, 2025, by Joseph Copeland.
| # | Наименование новости | Тональность | Информативность | Дата публикации |
|---|---|---|---|---|
| 1 | John Roberts Bemoans Americans for Viewing SCOTUS Justices as “Political Actors” | -3 | 6 | 08-05-2026 |
| 2 | Growing number of Americans lack confidence in Supreme Court: Survey | -3 | 7 | 18-07-2026 |
| 3 | Poll: Majority of Americans Disapprove of Supreme Court After Latest Term | 0 | 7 | 07-07-2026 |
| 4 | Большинство американцев считают систему правосудия несправедливой | 0 | 18.33 | 29-04-2026 |
| 5 | How confident are Americans in the midterm elections’ fairness and accuracy? | 0 | 10.42 | 05-08-2026 |
| 6 | Americans and the 2026 midterms | 0 | 11.17 | 31-07-2026 |
| 7 | Breaking Down The Vote: The High Court Term In Review | 0 | 5 | 02-07-2026 |
| 8 | ВЦИОМ: большинство россиян оценивают отношения России и США в негативном ключе | 0 | 0 | 18-11-2019 |
| 9 | Americans hold Canadians in high esteem. The reverse, not so much | 0 | 8.16 | 10-08-2026 |
| 10 | Confidence in U.S. Institutions Remains Near All-Time Low | 0 | 13.47 | 13-07-2026 |